mirror of
https://github.com/simonw/datasette-vega.git
synced 2026-09-25 11:24:15 +02:00
Datasette plugin for visualizing data using Vega
- JavaScript 65.4%
- Python 15.7%
- CSS 12.6%
- HTML 6.3%
| datasette_vega | ||
| public | ||
| src | ||
| tests | ||
| .gitignore | ||
| .travis.yml | ||
| datasette-vega.png | ||
| LICENSE | ||
| package.json | ||
| README.md | ||
| setup.py | ||


datasette-vega


A Datasette plugin that provides tools for generating charts using Vega.
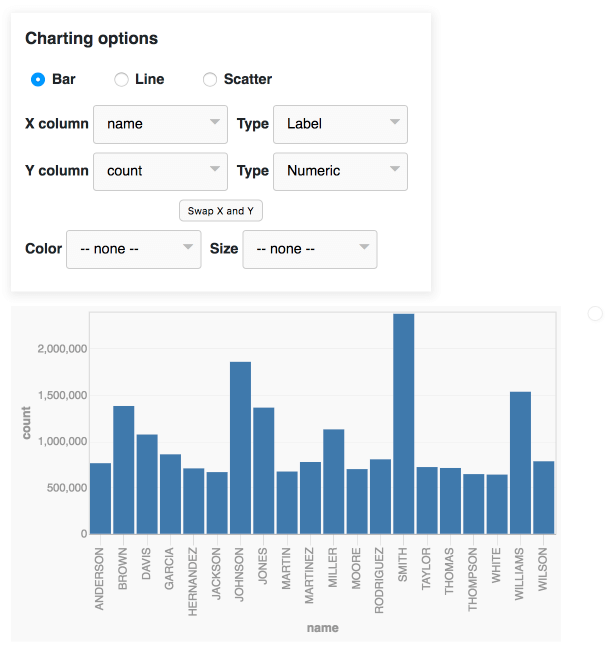
Try out the latest master build as a live demo at https://datasette-vega-latest.datasette.io/ or try the latest release installed as a plugin at https://fivethirtyeight.datasettes.com/
To add this to your Datasette installation, install the plugin like so:
pip install datasette-vega
The plugin will then add itself to every Datasette table view.
If you are publishing data using the datasette publish command, you can
include this plugin like so:
datasette publish now mydatabase.db --install=datasette-vega