- Python 79.4%
- JavaScript 11.4%
- HTML 6.2%
- CSS 2.7%
- Shell 0.1%
 8b35d4a80d
Spans describe requests that have finished. They structurally cannot answer "am I saturating my 3 SQL threads right now", because that is a level rather than an event - and with num_sql_threads defaulting to 3, it is usually the first thing worth knowing about a busy Datasette. This adds the metrics that answer it. Five observable gauges, computed only when something is collecting, so an instance with no MeterProvider installed does no work for them at all: datasette.sql.threads.limit num_sql_threads datasette.sql.threads.queue_depth queries waiting for a free thread datasette.sql.queries.pending in-flight reads, by db.namespace datasette.write.queue_depth writes behind the single write thread datasette.connections.open tracked file connections Three instruments recorded inline, which matters because metrics survive trace sampling and spans do not - an operator sampling 1% of traces still gets 100% of the latency distribution: db.client.operation.duration semconv histogram, with error.type datasette.write.queue_wait the metric twin of the existing span datasette.sql.queries.interrupted sql_time_limit_ms kills The interrupted counter closes a gap the plan called out as unanswerable: "how often are we killing queries at the limit" is a rate, and a rate cannot be recovered from sampled spans. Core still creates no provider of any kind, so the architecture is unchanged; `grep -rn 'opentelemetry.sdk' datasette/` stays empty. One real difference from tracing is worth recording: _ProxyMeter and its instruments forward to a provider installed after they were created, whereas ProxyTracer permanently caches the first concrete tracer it resolves. Module-level instruments are therefore safe and the test fixture has no ordering constraint. Live instances are tracked in a lock-guarded WeakSet so instrumenting an instance never keeps it alive. The pool gauges carry no attribute saying which Datasette produced them: production runs one instance per process, and adding an id to disambiguate the test suite's hundreds of instances would buy unbounded attribute cardinality to fix a case that does not occur. The collision is documented instead, and the gauge callbacks are plain generator functions so tests can assert exact values by calling them directly rather than through the SDK's last-value aggregation. demos/otel/metrics_demo.py fires 12 concurrent 40ms queries at a 3-thread pool and samples the gauges mid-flight: queue_depth peaks at exactly 9, and the duration histogram reads max=0.1695s for a query whose work is 40ms. That gap is the queue, and it is the thing traces alone will not show you. Also corrects the demo README's privacy section, which still claimed parameter values are never recorded - that stopped being unconditionally true when trace_sql_parameters landed. Co-Authored-By: Claude Opus 5 <noreply@anthropic.com> (cherry picked from 6ef0dd8c and adapted to the rebuilt phase-1 stack: attribute names now come from telemetry_registry where entries exist, the meter carries the instrumentation-scope version and schema URL, and the interrupted-queries counter skips expected timeouts - callers that opted into a deliberately short budget, like facet suggestion - matching how those are excluded from span error status. The internals.rst reference lands with the registry commit that follows.) Co-Authored-By: Claude Fable 5 <noreply@anthropic.com> Claude-Session: https://claude.ai/code/session_01F2h9ANGZ7paWSpqs5DUAcG |
||
|---|---|---|
| .github | ||
| datasette | ||
| demos | ||
| docs | ||
| tests | ||
| .coveragerc | ||
| .dockerignore | ||
| .git-blame-ignore-revs | ||
| .gitattributes | ||
| .gitignore | ||
| .isort.cfg | ||
| .prettierrc | ||
| .readthedocs.yaml | ||
| CODE_OF_CONDUCT.md | ||
| codecov.yml | ||
| Dockerfile | ||
| Justfile | ||
| LICENSE | ||
| MANIFEST.in | ||
| package-lock.json | ||
| package.json | ||
| pyproject.toml | ||
| pytest.ini | ||
| README.md | ||
| ruff.toml | ||
| setup.cfg | ||
| test-in-pyodide-with-shot-scraper.sh | ||








An open source multi-tool for exploring and publishing data
Datasette is a tool for exploring and publishing data. It helps people take data of any shape or size and publish that as an interactive, explorable website and accompanying API.
Datasette is aimed at data journalists, museum curators, archivists, local governments, scientists, researchers and anyone else who has data that they wish to share with the world.
Explore a demo, watch a video about the project or try it out on GitHub Codespaces.
- datasette.io is the official project website
- Latest Datasette News
- Comprehensive documentation: https://docs.datasette.io/
- Examples: https://datasette.io/examples
- Live demo of current
mainbranch: https://latest.datasette.io/ - Questions, feedback or want to talk about the project? Join our Discord
Want to stay up-to-date with the project? Subscribe to the Datasette newsletter for tips, tricks and news on what's new in the Datasette ecosystem.
Installation
If you are on a Mac, Homebrew is the easiest way to install Datasette:
brew install datasette
You can also install it using pip or pipx:
pip install datasette
Datasette requires Python 3.8 or higher. We also have detailed installation instructions covering other options such as Docker.
Basic usage
datasette serve path/to/database.db
This will start a web server on port 8001 - visit http://localhost:8001/ to access the web interface.
serve is the default subcommand, you can omit it if you like.
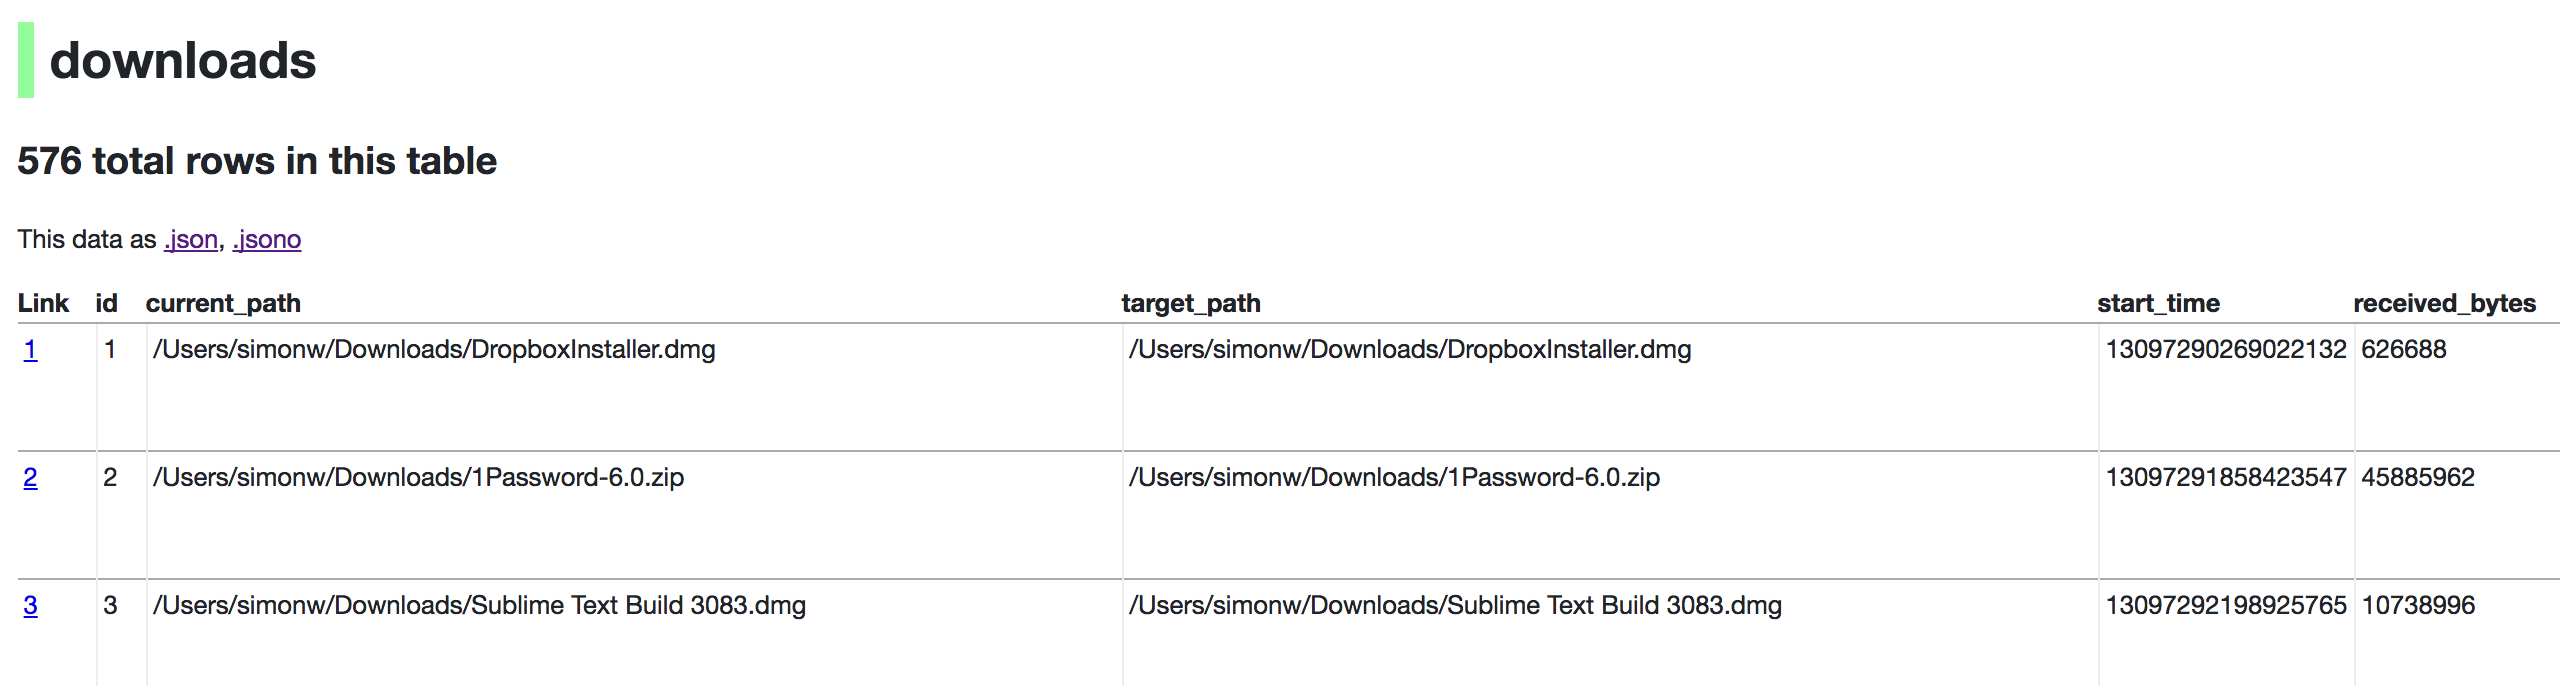
Use Chrome on OS X? You can run datasette against your browser history like so:
datasette ~/Library/Application\ Support/Google/Chrome/Default/History --nolock
Now visiting http://localhost:8001/History/downloads will show you a web interface to browse your downloads data:
metadata.json
If you want to include licensing and source information in the generated datasette website you can do so using a JSON file that looks something like this:
{
    "title": "Five Thirty Eight",
    "license": "CC Attribution 4.0 License",
    "license_url": "http://creativecommons.org/licenses/by/4.0/",
    "source": "fivethirtyeight/data on GitHub",
    "source_url": "https://github.com/fivethirtyeight/data"
}
Save this in metadata.json and run Datasette like so:
datasette serve fivethirtyeight.db -m metadata.json
The license and source information will be displayed on the index page and in the footer. They will also be included in the JSON produced by the API.
datasette publish
If you have Heroku or Google Cloud Run configured, Datasette can deploy one or more SQLite databases to the internet with a single command:
datasette publish heroku database.db
Or:
datasette publish cloudrun database.db
This will create a docker image containing both the datasette application and the specified SQLite database files. It will then deploy that image to Heroku or Cloud Run and give you a URL to access the resulting website and API.
See Publishing data in the documentation for more details.
Datasette Lite
Datasette Lite is Datasette packaged using WebAssembly so that it runs entirely in your browser, no Python web application server required. Read more about that in the Datasette Lite documentation.