
2.9 KiB
datasette-vega


A Datasette plugin that provides tools for generating charts using Vega.
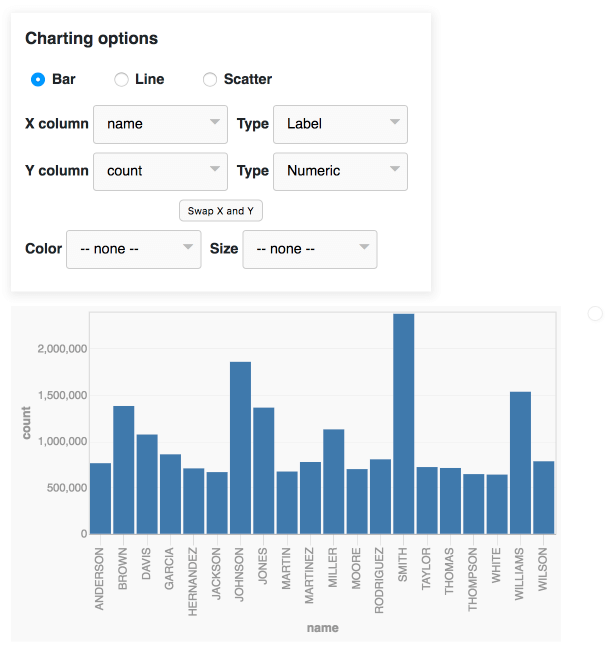
Try out the latest master build as a live demo at https://datasette-vega-latest.datasette.io/ or try the latest release installed as a plugin at https://fivethirtyeight.datasettes.com/
To add this to your Datasette installation, install the plugin like so:
pip install datasette-vega
The plugin will then add itself to every Datasette table and database query view.
If you are publishing data using the datasette publish command, you can
include this plugin like so:
datasette publish vercel mydatabase.db --install=datasette-vega
(see datasette-publish-vercel)
Development
To contribute to this tool, first checkout the code:
git clone git@github.com:simonw/datasette-vega.git
Then, install dependencies:
npm install
"Dev" mode demo
Then, you will be able to run a hot-reloading development server:
npm start
"Prod" mode demo
You can build static assets for distribution with:
npm run build
You'll find the built assets in the build/ directory, and can serve them with:
npm install -g serve  # if you don't already have `serve` installed
serve -s build
serve will copy a URL to your clipboard, which you can then paste into your browser:

Try expanding "Examples" and checking out some sample charts:

Plugin build
To build the plugin, run:
python setup.py bdist_wheel
This will run the npm run build command and move the built assets into datasette_vega/static/, where they will be included in the plugin's Python package.
Testing plugin
You can install your own fork of this repo into your Datasette environment like so:
GITHUB_USER=YOUR_GITHUB_USERNAME
datasette install 'datasette-vega @ git+https://github.com/${GITHUB_USER}/datasette-vega'
If in doubt, the GitHub Actions configs in .github/workflows/ are a good place to look for how to run tests and build the plugin.